Reviving Mosquitto Exporter: bringing Prometheus monitoring back to Eclipse Mosquitto
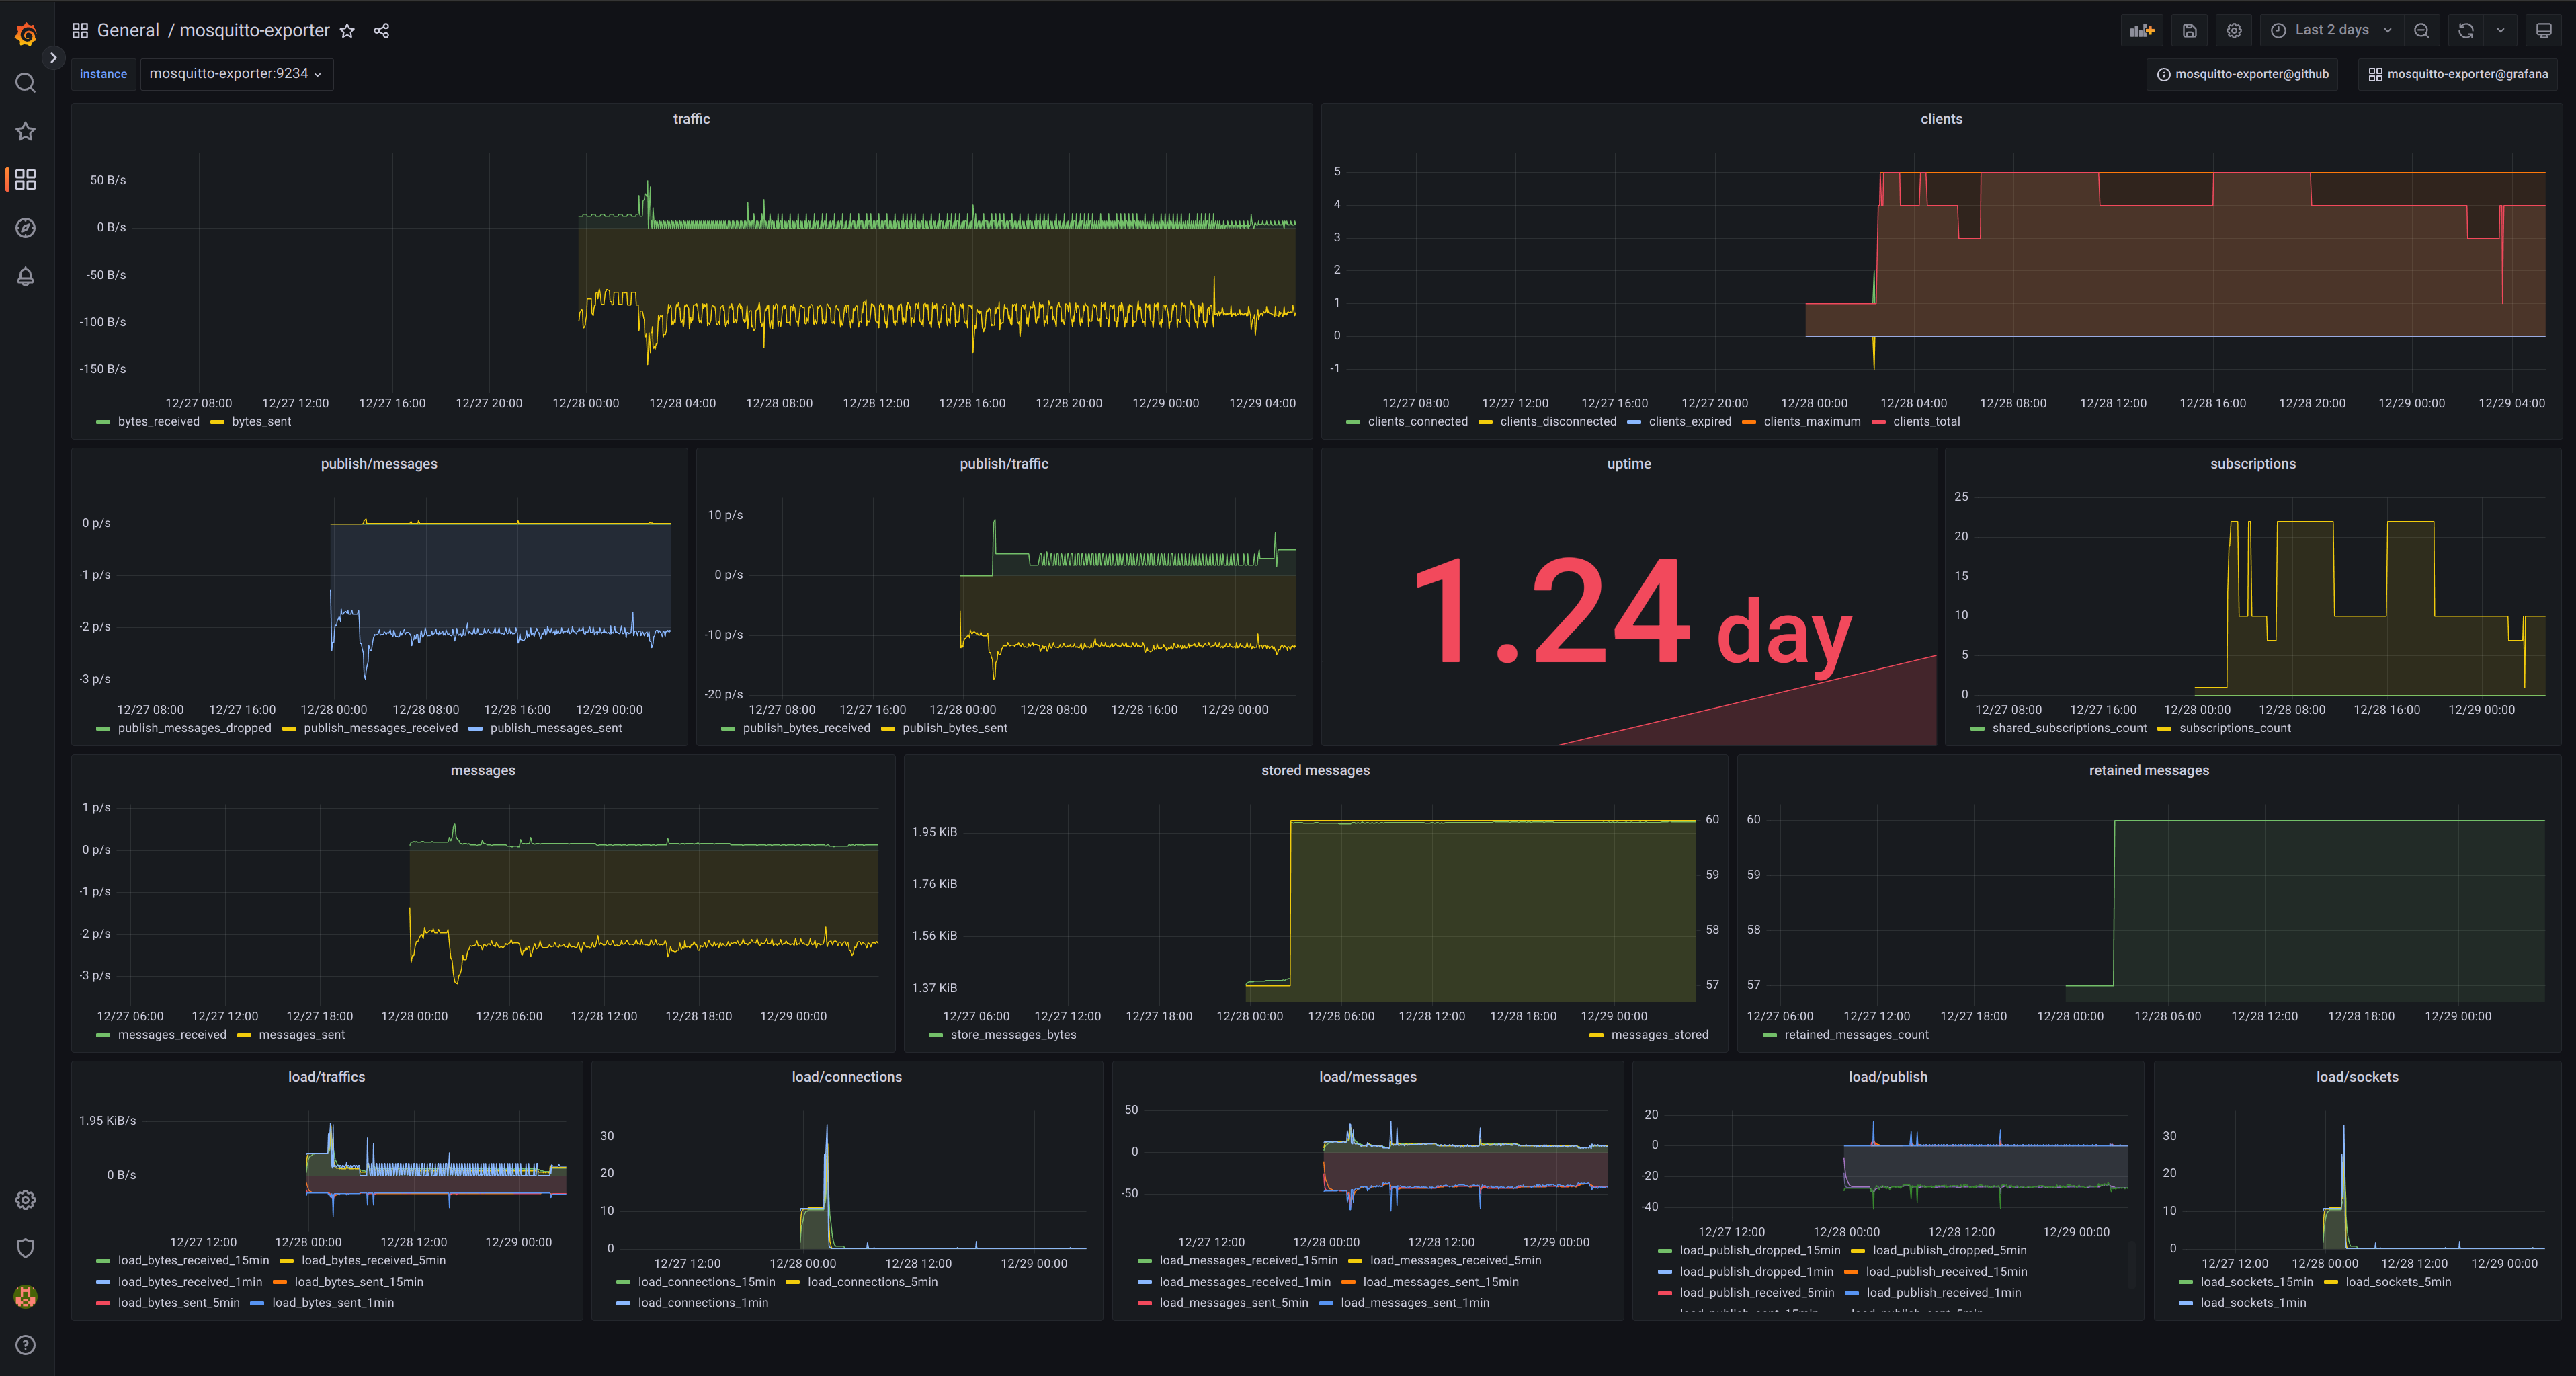
Reviving Mosquitto Exporter: bringing Prometheus monitoring back to Eclipse Mosquitto
Monitoring is one of those things that becomes invisible when everything works correctly.
Until it doesn’t.
In the last few months I started using more and more MQTT-based setups for IoT and edge projects. In many of these environments I chose Eclipse Mosquitto as the MQTT broker because it is lightweight, reliable and extremely easy to deploy.
But while building production-ready environments around Mosquitto, I quickly realized something:
the monitoring ecosystem around it was partially abandoned.
The most complete Prometheus exporter available was the excellent sapcc/mosquitto-exporter, but unfortunately the project had not been maintained for quite some time.
Dependencies were getting old, Docker images were outdated and multi-architecture support was missing.
So instead of starting from scratch, I decided to fork the project and bring it back to life.
Repository:
- GitHub: https://github.com/rommelandrea/mosquitto-exporter
- Docker Hub: https://hub.docker.com/r/rommelandrea/mosquitto-exporter
Why not create a new exporter?
One thing I strongly believe in is that open source maintenance matters just as much as open source creation.
Today the software ecosystem is full of abandoned but valuable infrastructure projects.
Very often the best engineering decision is not rewriting everything from scratch, but:
- modernizing
- stabilizing
- maintaining
- documenting
- extending
The original exporter already had a solid base and correctly implemented the core functionality needed to expose Mosquitto metrics to Prometheus.
The real problem was sustainability.
So the goal of this fork is simple:
keep the project healthy, modern and production-ready.
What’s included in the first release
The initial release focuses on modernizing the project and making deployment easier across different environments.
Updated dependencies
The codebase and dependencies have been updated to keep the exporter compatible with modern environments and current container ecosystems.
Multi-architecture Docker images
One of the biggest improvements is full multi-architecture support.
Docker images are now available for:
- amd64
- arm64
This makes the exporter suitable not only for cloud and server deployments, but also for:
- Raspberry Pi
- edge gateways
- industrial IoT environments
- homelab setups
Multiple image variants
Images are available in multiple variants depending on deployment requirements:
scratchalpineubi9
This gives flexibility depending on:
- image size requirements
- debugging needs
- enterprise compliance requirements
Ready for Prometheus monitoring
The exporter is immediately usable with Prometheus-based monitoring stacks.
Typical use cases include:
- MQTT broker monitoring
- IoT infrastructure observability
- edge device monitoring
- message throughput visibility
- broker health monitoring
Quick Start
Docker
The fastest way to start the exporter is using Docker.
docker run -d \
  --name mosquitto-exporter \
  -p 9234:9234 \
  -e MQTT_SERVER=tcp://mosquitto:1883 \
  rommelandrea/mosquitto-exporter
Docker Compose
services:
  mosquitto-exporter:
    image: rommelandrea/mosquitto-exporter
    ports:
      - "9234:9234"
    environment:
      MQTT_SERVER: tcp://mosquitto:1883
Prometheus configuration
scrape_configs:
  - job_name: mosquitto
    static_configs:
      - targets:
          - mosquitto-exporter:9234
Once configured, Prometheus will start collecting metrics exposed by the exporter.
Why monitoring MQTT matters
MQTT infrastructures are often deployed in environments where reliability is critical:
- industrial systems
- energy monitoring
- building automation
- IoT platforms
- edge computing
In many of these scenarios, problems can remain invisible for a long time without proper observability.
Monitoring MQTT brokers helps detect:
- connection spikes
- unstable clients
- broker overload
- unexpected disconnects
- throughput anomalies
- infrastructure instability
And in distributed edge environments, observability becomes even more important because debugging remote systems is usually much harder.
What’s coming next
The current release focuses mainly on stabilizing and modernizing the project.
Over the next months I plan to work on:
- topic monitoring
- production-ready Grafana dashboards
- additional metrics
- improved broker visibility
- easier deployment examples
- documentation improvements
- Kubernetes deployment examples
The goal is to make the exporter easy to adopt even for small teams and self-hosted environments.
Open source maintenance is infrastructure work
One thing that is often underestimated in software engineering is maintenance.
Small infrastructure tools frequently become critical dependencies in production systems.
But once the initial excitement around a project disappears, many repositories slowly stop evolving.
I think maintaining useful tools is one of the most valuable contributions we can make as engineers.
Especially in areas like:
- monitoring
- observability
- IoT
- DevOps
- edge infrastructure
where reliability matters much more than hype.
Contributing
If you are using Mosquitto in:
- production environments
- IoT systems
- homelabs
- edge deployments
- Kubernetes clusters
feel free to try the exporter and share feedback.
Contributions, issues, ideas and testing feedback are always welcome.
Repository:
https://github.com/rommelandrea/mosquitto-exporter
If you find the project useful, consider starring the repository to help more people discover it.